


Shelf design with Shelfmatic
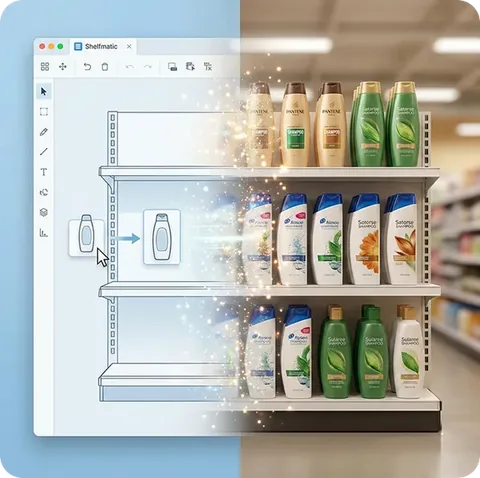
You can start by duplicating any planogram with the same shelf level. Some planogram software behaves like drawing programs and can bother you with physical shelf designs before you can place products. The goal of Shelfmatic is to obtain realistic visuals based on shelf and product package dimensions as quickly as possible.
Select a planogram and duplicate it, then directly enter the number of shelf levels and width, and clear all shelves to prepare the module instantly (e.g., 7 levels, 120 cm wide). Now, adjust shelf levels to your desired height by directly entering centimeters. Select and save your aisle, and you'll see the products for that aisle on the left.
As you place products on the shelf, you'll see the list decrease. This way, when you've placed all products, new products can appear based on purchasing decisions. You can view this list sorted by tonnage-brand, brand-model groups, or other preferences. You can also choose to include or exclude products that have been placed in the planogram.
As you position products, you can enter horizontal and vertical facings for the selected product on the information card on the right. You can place products using the drag-and-drop method, to any shelf level and among any products. For each shelf level, you can specify a certain number of facings for the products there collectively.
You can duplicate shelf levels, and if products are duplicated as well, you can delete them all with one key. You can duplicate modules and empty new modules.
If you have private labels, you can display them with a special label next to the product name. Product metrics introduced to the system (profit margin, sales share, etc.) can also be seen on the information card. Of course, package width, height, and depth values are the most critical for realistic design.
With infographic options, you can turn all product metrics in the system into a heat map and perform unique comparative analyses on the design. Depending on your selection, you can see infographic colorings in full boxes or just the frame. Based on the infographic definition, you can display color transitions between certain tones or show specific colors according to certain value ranges.